Misc
Explainer: The Different Types of Volcanoes on Earth
Article/Editing:
Click to view a larger version of the graphic.
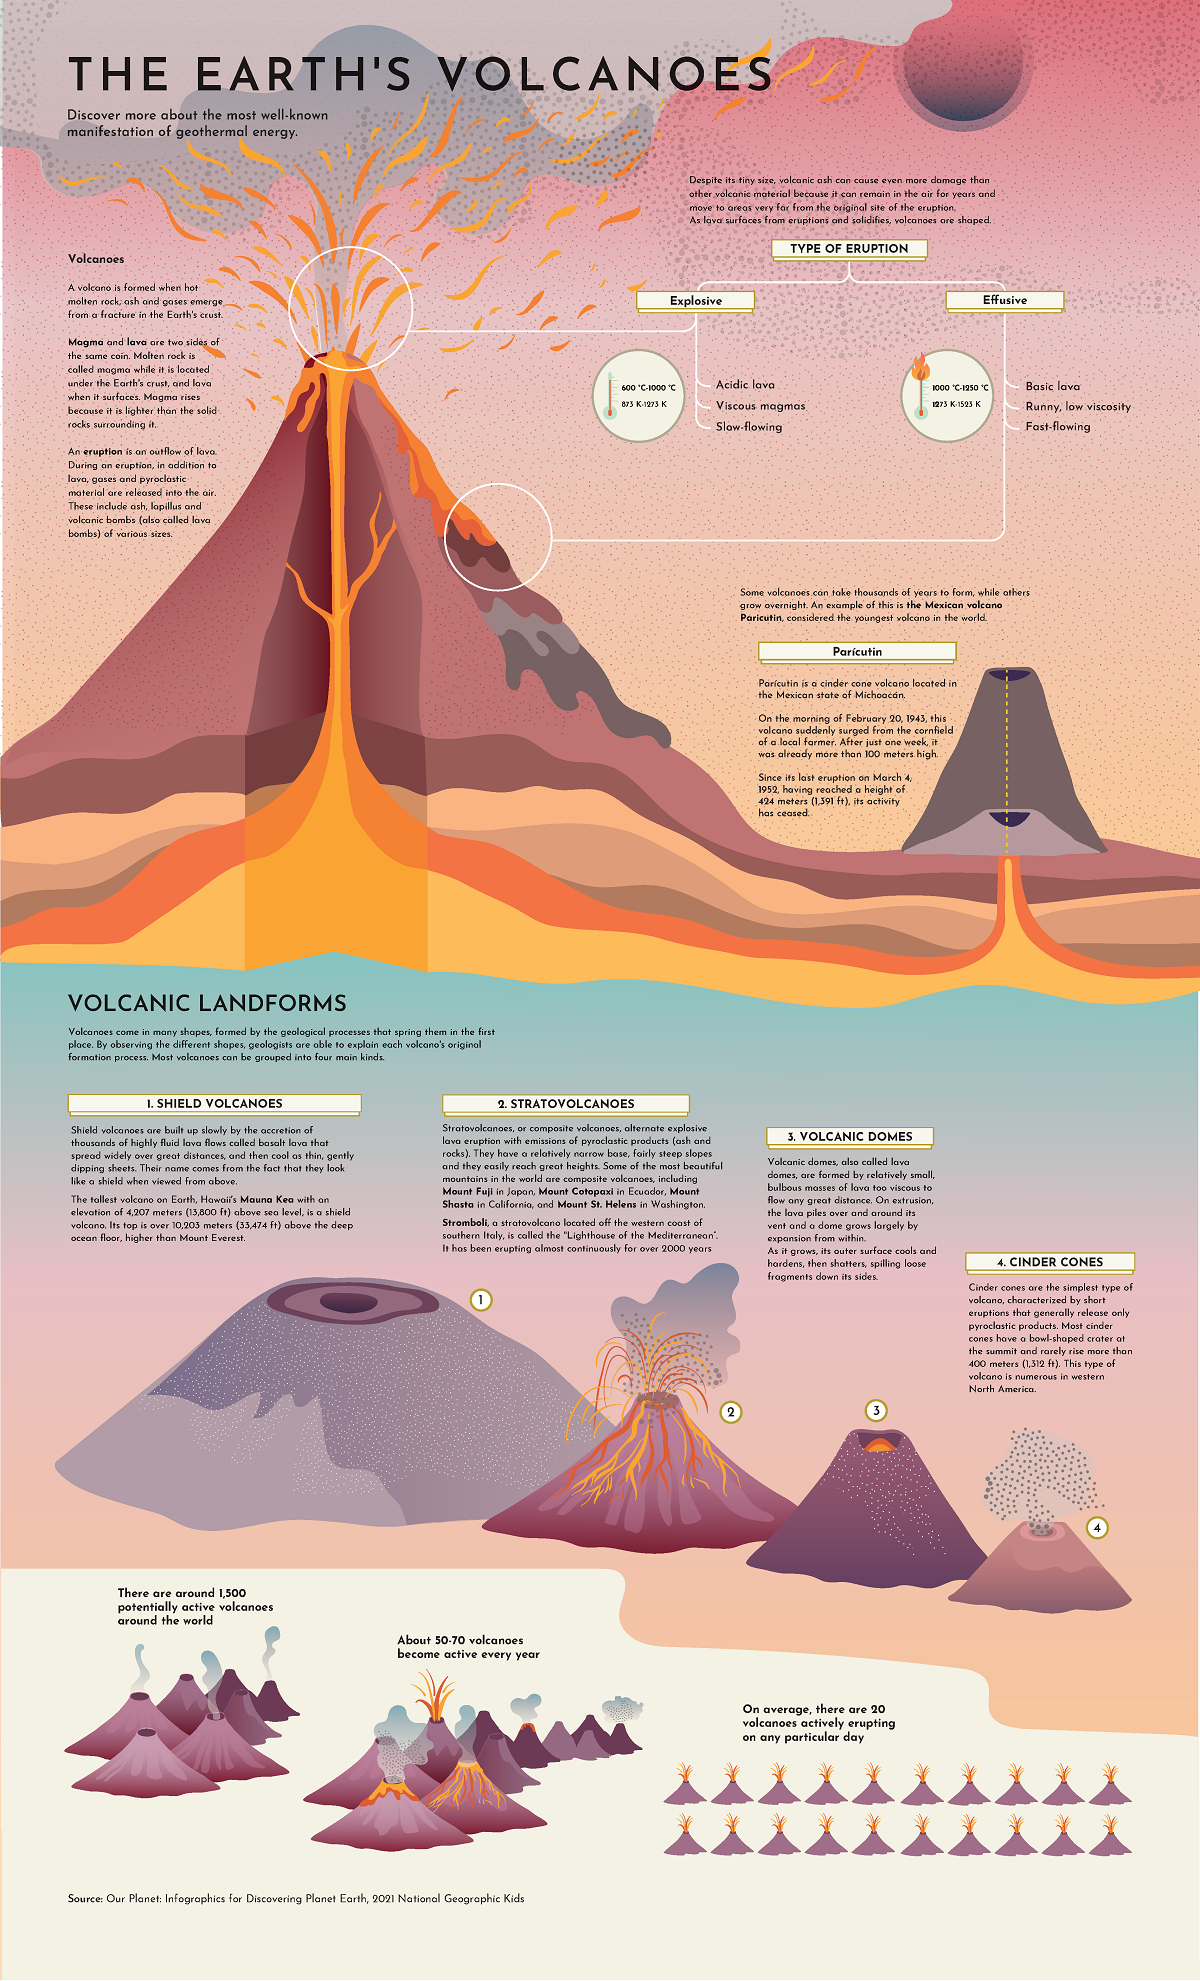
Explainer: The Different Types of Volcanoes on Earth
Even if you don’t live near a volcano, you’ve been impacted by their activity.
It’s estimated that more than 80% of our planet’s surface has been shaped by volcanic activity. They’ve helped create our mountain ranges, plains, and plateaus, and have even helped fertilize the land that we now use to grow crops.
These critical mounds come in many shapes and sizes. This graphic by Giulia De Amicis provides a brief introduction to volcanoes, explaining their different types of shapes and eruptions.
Types of Eruptions
A volcano starts to form when molten rock rises from a crack in the Earth’s surface, which often emerge along tectonic plate boundaries.
Magma rises to the Earth’s surface because it’s lighter than rock. When it surfaces or erupts, it’s referred to as lava.
There are various types of volcanic eruptions, depending on the lava’s temperature, thickness, and composition. Generally speaking, high gas content and high viscosity lead to explosive eruptions, while low viscosity and gas content lead to an effusive, or steadily flowing, eruption.
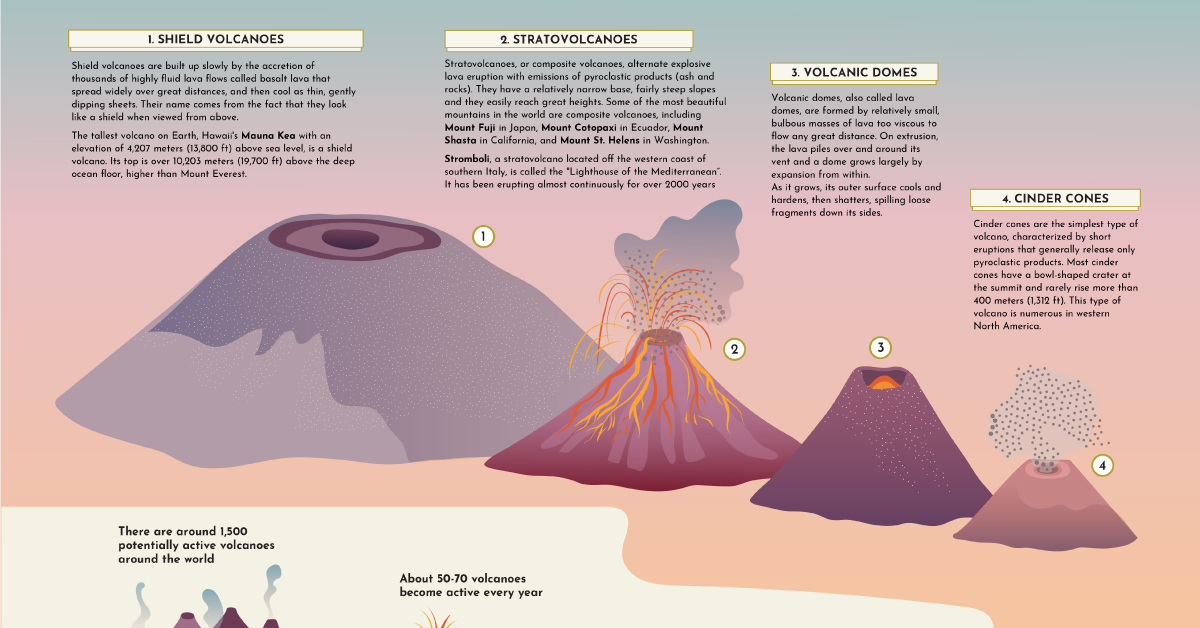
The Four Main Types of Volcanoes
Volcanoes vary in size and structure, depending on how they’re formed. Most volcanoes types fall into four main groups:
Shield Volcanoes
Shield volcanoes are built slowly, from low-viscosity lava that spreads far and quick. The lava eventually dries to form a thin, wide sheet, and after repeated eruptions, a mount starts to form.
From the top, these types of volcanoes look like a shield, hence the name. While these volcanoes take a while to form, they aren’t necessarily low. In fact, the world’s tallest active volcano, Mauna Kea in Hawaii, is a shield volcano.
Stratovolcanoes
Also known as composite volcanoes, stratovolcanoes are built relatively fast, at least compared to shield volcanoes. This is because, in between lava eruptions, composite volcanoes emit ash and rock, which helps add structure to the mound rather quickly.
Some well-known composite volcanoes are Mount Fuji in Japan, Mount St. Helens in Washington, and Mount Cotopaxi in Ecuador.
Volcanic Domes
Opposite to shield volcanoes, volcanic domes are formed when lava is highly-viscous. Because the thick lava can’t travel very far, it starts to pool around the volcano’s vent.
This can sometimes create a pressure build-up, meaning dome volcanoes are prone to explosive eruptions.
Cinder Cones
These types of volcanoes typically don’t release lava. Rather, their eruptions typically emit volcanic ash and rocks, known as pyroclastic products.
Cinder cones are characterized by a bowl-shaped crater at the top, and usually don’t exceed 400 m (1,312 ft) in height.
How Volcanoes Benefit the Earth
Volcanoes have a number of ecological benefits. Once broken down, volcanic materials create exceptionally fertile soil, which can help build prospering new habitats for animals and plants.
Volcanic eruptions can also help cool our climate. When a volcano explodes, ash and sulfur gas from the eruption combine with water droplets and get trapped in the atmosphere for years. This has a cooling effect which is extremely beneficial to us, especially given our current global warming situation.
Dr. Tracy Gregg, associate professor for the University at Buffalo’s geology department, told Accuweather that “volcanoes have actually helped to keep the world about 2 to 3 degrees cooler than it otherwise may be.”

This article was published as a part of Visual Capitalist's Creator Program, which features data-driven visuals from some of our favorite Creators around the world.


Misc
The Top 25 Nationalities of U.S. Immigrants
Mexico is the largest source of immigrants to the U.S., with almost 11 million immigrants.


The Top 25 Nationalities of U.S. Immigrants
This was originally posted on our Voronoi app. Download the app for free on iOS or Android and discover incredible data-driven charts from a variety of trusted sources.
The United States is home to more than 46 million immigrants, constituting approximately 14% of its total population.
This graphic displays the top 25 countries of origin for U.S. immigrants, based on 2022 estimates. The data is sourced from the Migration Policy Institute (MPI), which analyzed information from the U.S. Census Bureau’s 2022 American Community Survey.
In this context, “immigrants” refer to individuals residing in the United States who were not U.S. citizens at birth.
Mexico Emerges as a Leading Source of Immigration
Mexico stands out as the largest contributor to U.S. immigration due to its geographical proximity and historical ties.
Various economic factors, including wage disparities and employment opportunities, motivate many Mexicans to seek better prospects north of the border.
| Country | Region | # of Immigrants |
|---|---|---|
| 🇲🇽 Mexico | Latin America & Caribbean | 10,678,502 |
| 🇮🇳 India | Asia | 2,839,618 |
| 🇨🇳 China | Asia | 2,217,894 |
| 🇵🇭 Philippines | Asia | 1,982,333 |
| 🇸🇻 El Salvador | Latin America & Caribbean | 1,407,622 |
| 🇻🇳 Vietnam | Asia | 1,331,192 |
| 🇨🇺 Cuba | Latin America & Caribbean | 1,312,510 |
| 🇩🇴 Dominican Republic | Latin America & Caribbean | 1,279,900 |
| 🇬🇹 Guatemala | Latin America & Caribbean | 1,148,543 |
| 🇰🇷 Korea | Asia | 1,045,100 |
| 🇨🇴 Colombia | Latin America & Caribbean | 928,053 |
| 🇭🇳 Honduras | Latin America & Caribbean | 843,774 |
| 🇨🇦 Canada | Northern America | 821,322 |
| 🇯🇲 Jamaica | Latin America & Caribbean | 804,775 |
| 🇭🇹 Haiti | Latin America & Caribbean | 730,780 |
| 🇬🇧 United Kingdom | Europe | 676,652 |
| 🇻🇪 Venezuela | Latin America & Caribbean | 667,664 |
| 🇧🇷 Brazil | Latin America & Caribbean | 618,525 |
| 🇩🇪 Germany | Europe | 537,484 |
| 🇪🇨 Ecuador | Latin America & Caribbean | 518,287 |
| 🇵🇪 Peru | Latin America & Caribbean | 471,988 |
| 🇳🇬 Nigeria | Africa | 448,405 |
| 🇺🇦 Ukraine | Europe | 427,163 |
| 🇮🇷 Iran | Middle East | 407,283 |
| 🇵🇰 Pakistan | Asia | 399,086 |
| Rest of World | 11,637,634 | |
| Total | 46,182,089 |
Mexicans are followed in this ranking by Indians, Chinese, and Filipinos, though most immigrants on this list come from countries in the Latin American and Caribbean region.
On the other hand, only three European countries are among the top sources of U.S. immigrants: the UK, Germany, and Ukraine.
Immigration continues to be a significant factor contributing to the overall growth of the U.S. population. Overall population growth has decelerated over the past decade primarily due to declining birth rates.
Between 2021 and 2022, the increase in the immigrant population accounted for 65% of the total population growth in the U.S., representing 912,000 individuals out of nearly 1.4 million.
If you enjoyed this post, be sure to check out Visualized: Why Do People Immigrate to the U.S.? This visualization shows the different reasons cited by new arrivals to America in 2021.

-

 Personal Finance1 week ago
Visualizing the Tax Burden of Every U.S. State
-

 Misc6 days ago
Visualized: Aircraft Carriers by Country
-

 Culture6 days ago
How Popular Snack Brand Logos Have Changed
-

 Mining1 week ago
Visualizing Copper Production by Country in 2023
-

 Misc1 week ago
Charted: How Americans Feel About Federal Government Agencies
-

 Healthcare1 week ago
Which Countries Have the Highest Infant Mortality Rates?
-

 Demographics1 week ago
Mapped: U.S. Immigrants by Region
-

 Maps1 week ago
Mapped: Southeast Asia’s GDP Per Capita, by Country